How to visualise a dataset
You have your .json and .h5 files.
Preparing for exploration
- Start the
 standalone app
 - In the
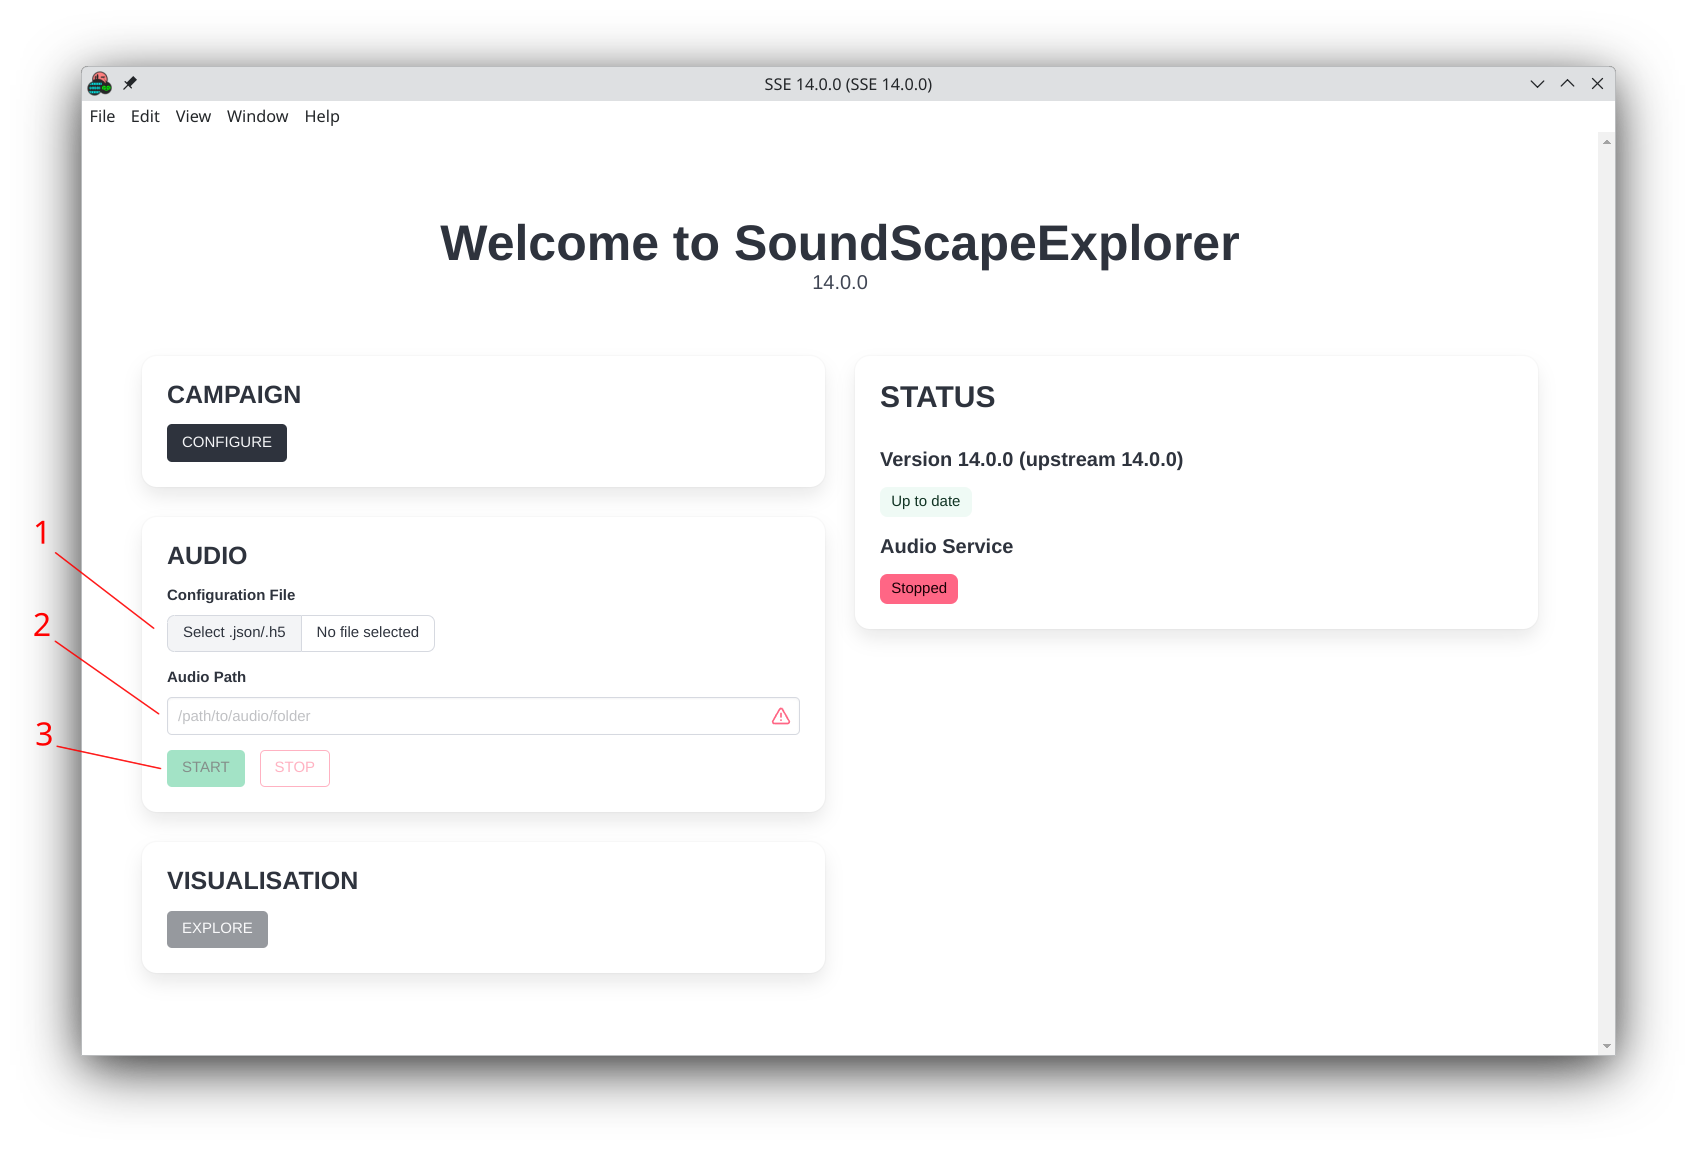
Audiosection, either- Fill the audio path by inputting one of your files (1)
- Or enter the path manually (2)
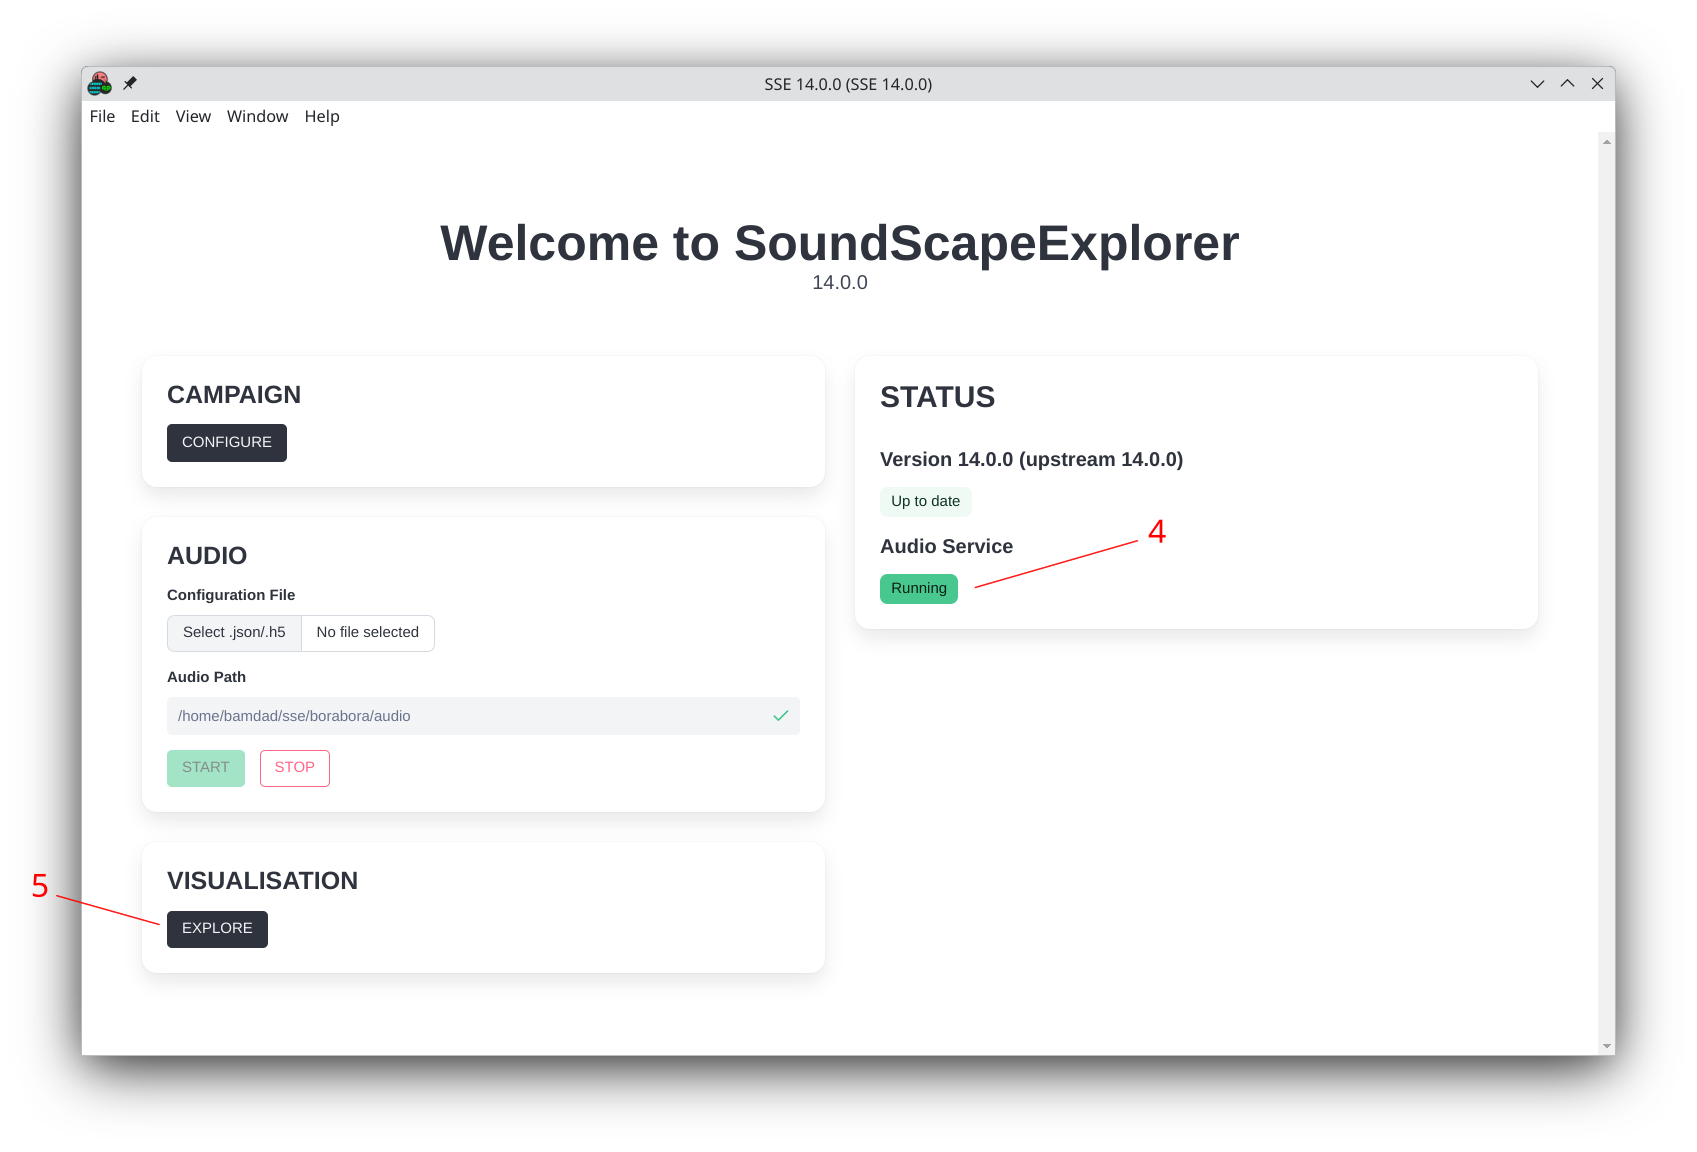
- Click on the start button (3)
- The audio engine will start (4)
- Allowing you to click
on the
Visualisation > Explorebutton (5)
- Audio Engine OFF
- Audio Engine ON
On Windows systems, you might get a firewall notification. Accept the prompt.
Loading your dataset
A new visualisation window opens after clicking on the Explore button.
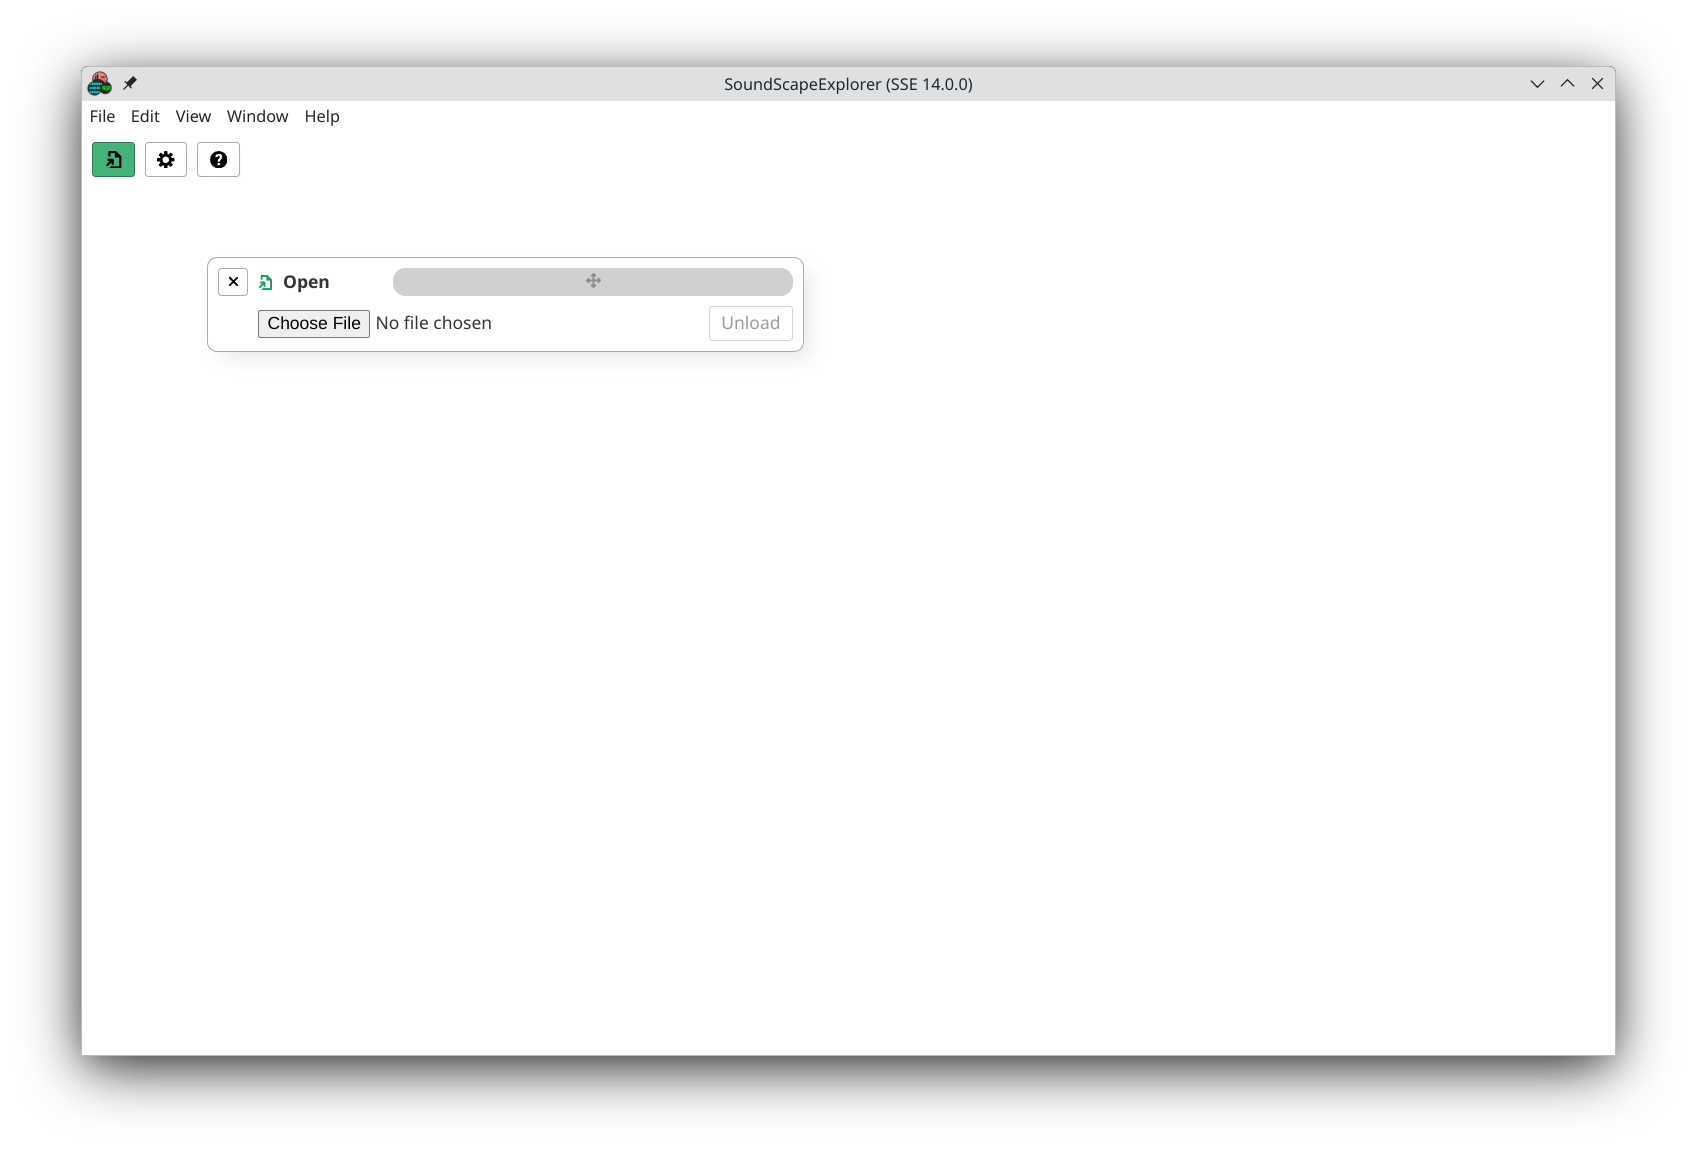
One more final step...
Choose your .h5 and load it.
The Open panel will close and the View one will open.
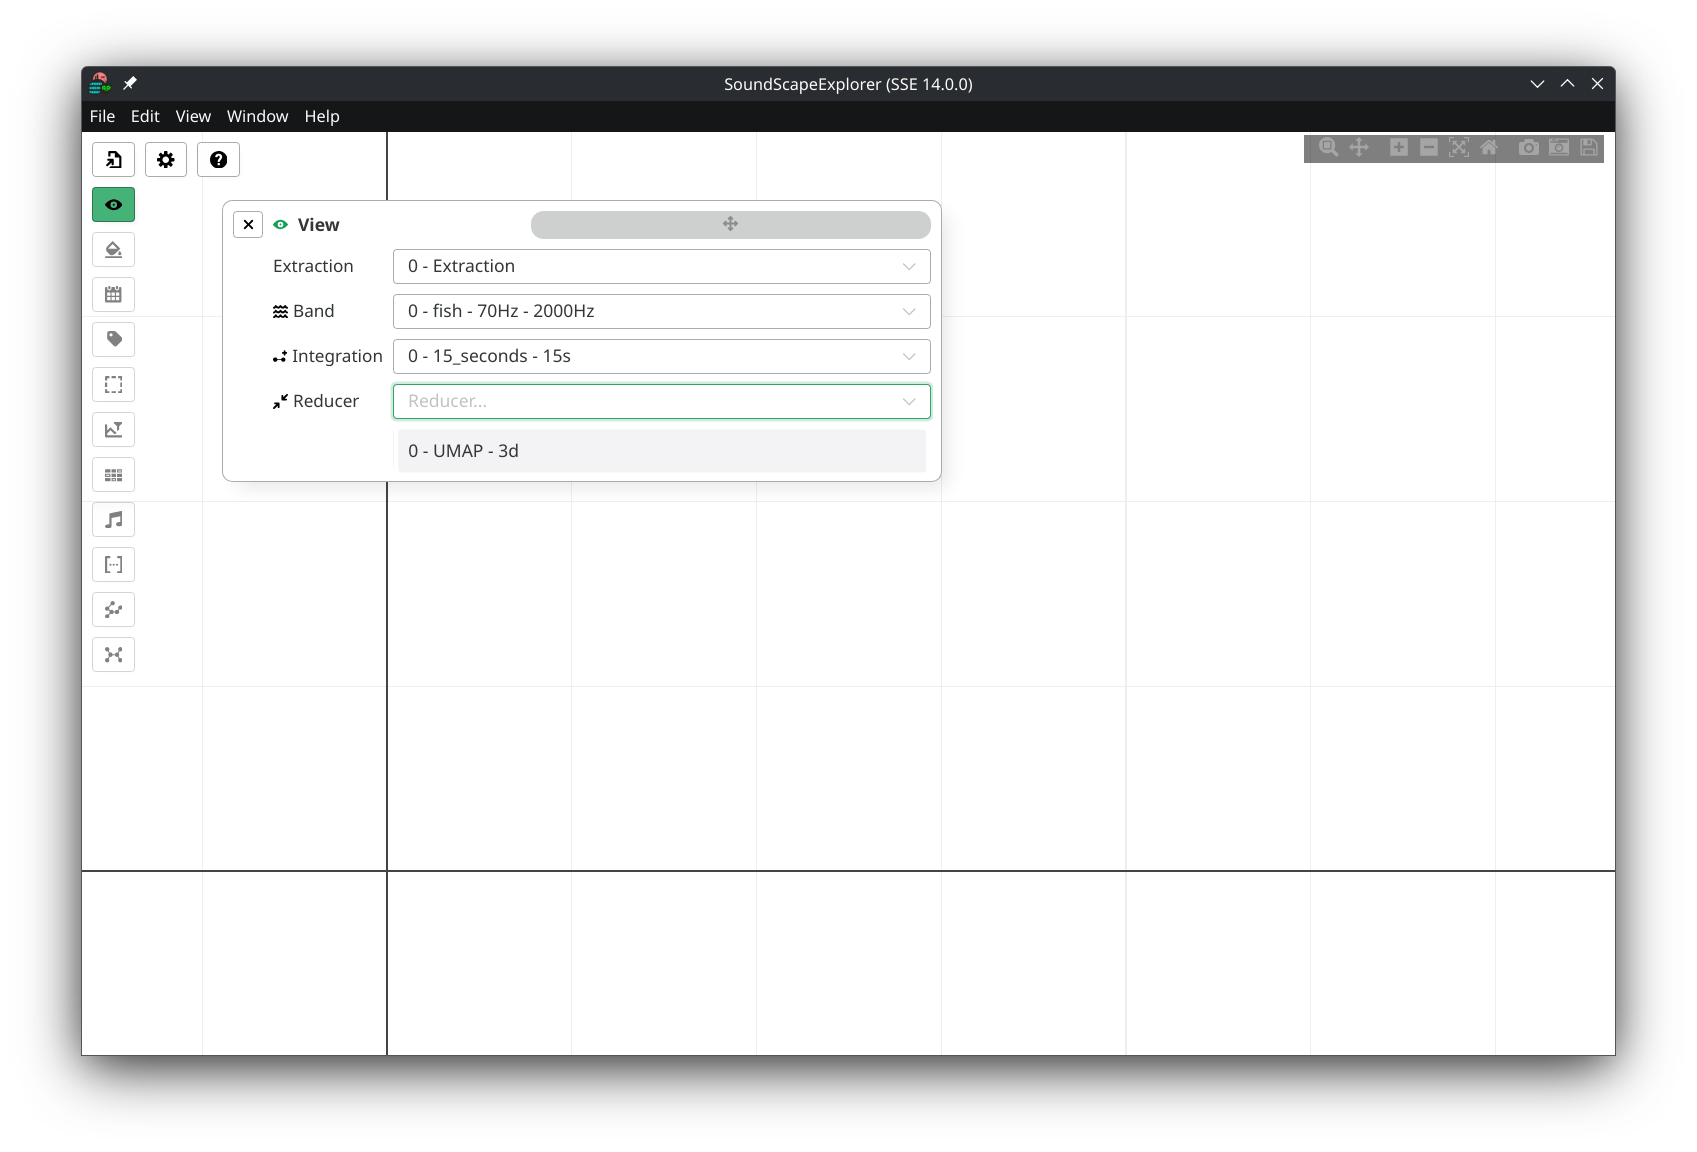
This is where you select your:
- Extraction
- Band
- Integration
- Reducer
Once your selection done, the View panel automatically closes and data starts loading.
Depending on your dataset size, data can take minutes to load entirely.
Exploring
Data loading is complete!
You can now see the scatter plot.
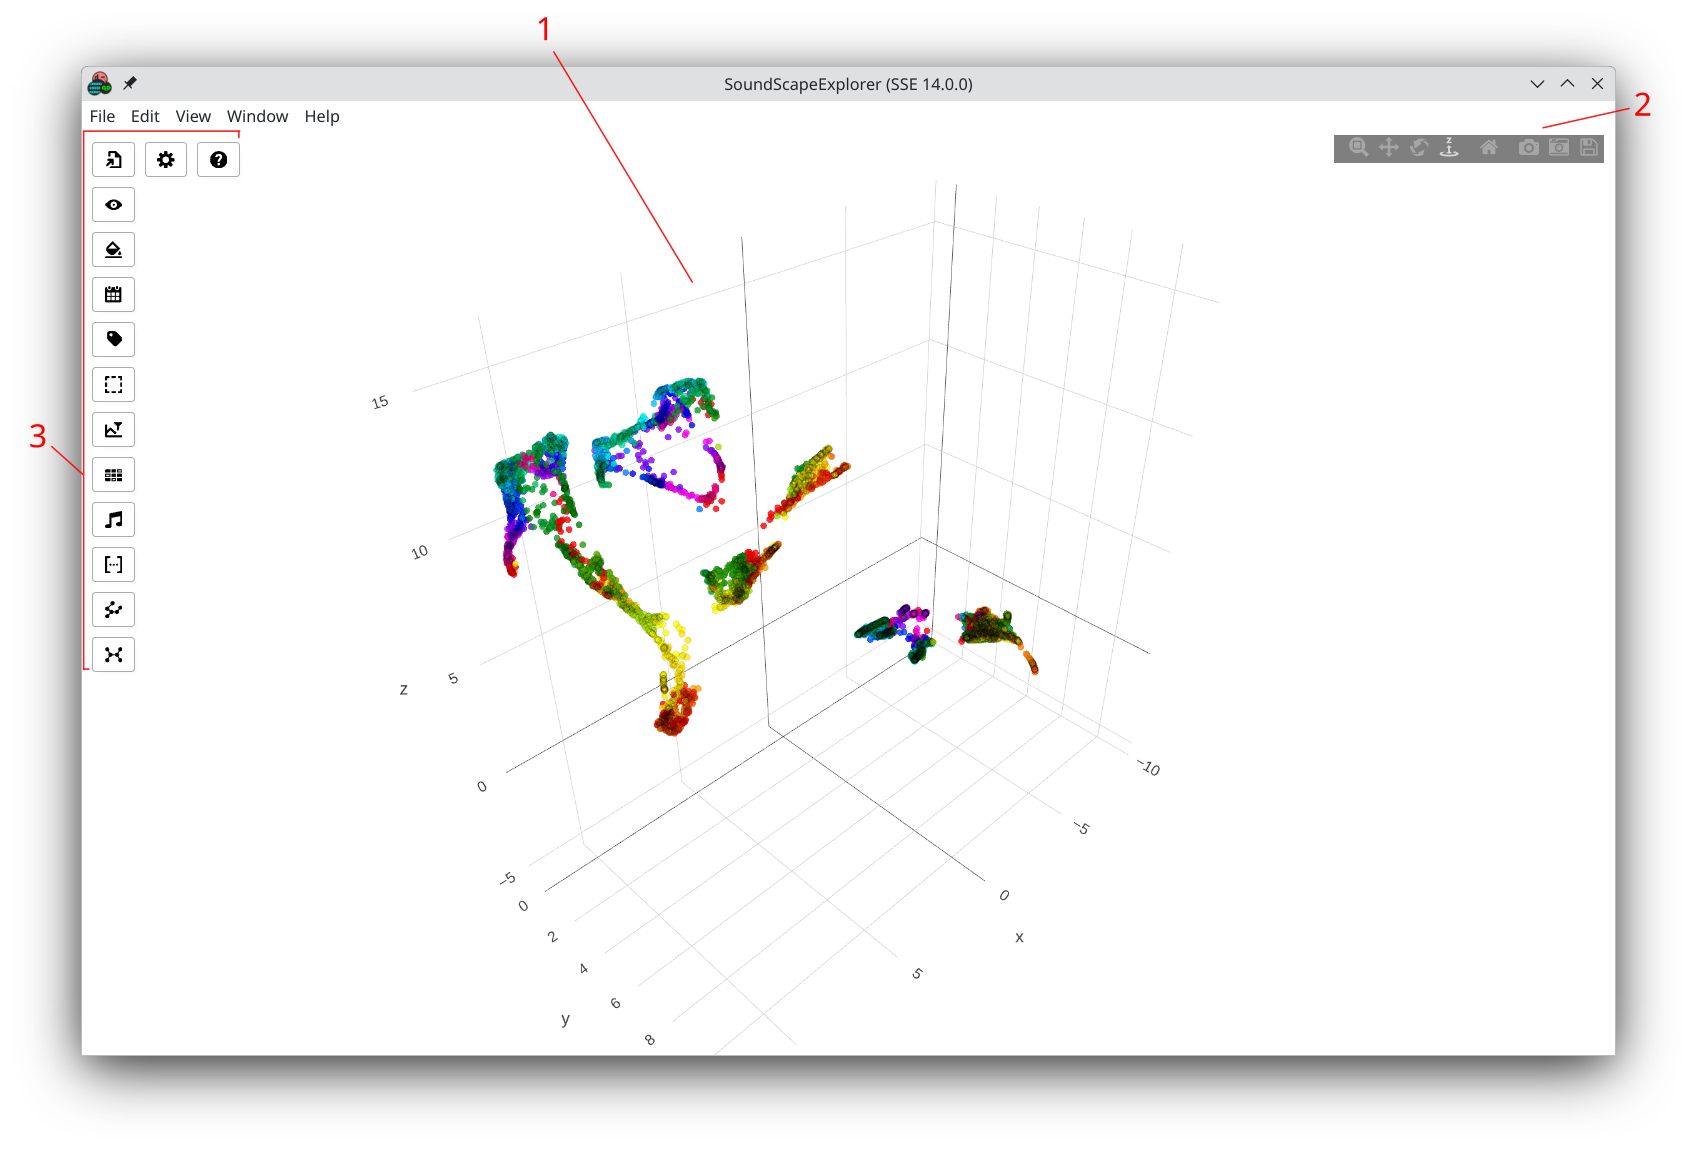
This screen has three main parts:
- The scatter (1)
- The camera controls and quick actions (2)
- The panel buttons (3) (reference)
In the center, the scatter (1) plots points, either in 2D or 3D depending on your reducer setting.
Each of these points represents an audio interval, with the length
of your Integration value.
The underlying represented data for each interval
depends on your actual Extractor setting.
This can be either neural network embeddings that have been reduced, or a combination of them, or even with raw or acoustic indices mixed in.